Computerized Mathematics
Illustrations of important ideas
In the graph above, we see a section of a "parabola" (y = x2); the "derivative"  y' = 2x means that the slope of the curve, at any point on the x-axis, is twice the x value at that point -- thus, the green line above, at x = .5, has a slope of 1 (45o).
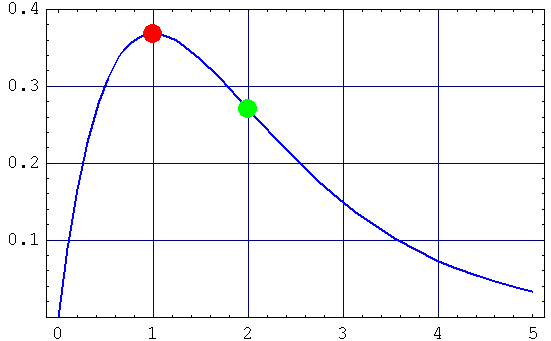
This "differentiation" can be used in "curve analysis", as shown below, where the red point represents the "peak", and the green point is the "inflection point" (at which the curvature "changes direction"):
y = xe-x
Many "graphing calculators" do this "numerically" (which can take time); or, a language like Mathematica can do it automatically, with code like this:
"Integrating"  y = x2, between the limits of x = .2 and .8,
yields the result .168, meaning that the shaded area between the x-axis and the curve, between x = .2 and .8, is .168 units of the graph's area.
"Differentiating" either y = x2, or y = x2 + 3,
yields "2x", because the slope of parabolas, when they are raised or lowered in the y direction, is still the same at all x values; so, integrating y' = 2x
yields "x2", but, more completely, the answer is "x2 + c", with "c" being the "constant of integration" -- thus, y = x2 + c is the solution of the "differential equation" y' = 2x, so that this one equation, instead of describing only one curve, describes a field of curves, as shown below.
This is only a very rudimentary illustration of a huge subject: this may involve, for example, a 3-dimensional description of interacting magnetic fields in a motor, with a fourth dimension, in the form of time, allowing a computer to make a moving simulation of what happens as the motor runs; or, it might show stress fields in a bridge, varying in time as a heavy truck crosses it; or, the explosion of a "supernova" star.


